Park Factors and the Air
Unlike most other professional sports, there is very little standardization when it comes to baseball fields. While sports like football, basketball, and soccer all have perfectly standardized areas o…
Unlike most other professional sports, there is very little standardization when it comes to baseball fields. While sports like football, basketball, and soccer all have perfectly standardized areas of play that are consistent across all stadiums, baseball stadiums can be very irregular. The famously odd Fenway Park in Boston, for example, has distances of 310 and 302 feet between home plate and its left and right field foul poles, respectively, both the shortest home plate to outfield distances in all of Major League Baseball. However, its left field wall–nicknamed the Green Monster–is over 37 feet tall, which is especially weird considering the right field wall is at times only 3 feet tall. On the other side of the spectrum, Kauffman Stadium in Kansas City is perfectly symmetrical, but its left and right field foul pole distances of 330 feet create a cavernous outfield that frequently results in the ballpark seeing the fewest home runs hit out of any MLB stadium.
As you might expect, this drastic variation in stadium shape has resulted in a drastic variation in offensive outcomes by stadium. Comerica Park has a much larger outfield than Yankee Stadium, meaning batted balls that reach the outfield can stay there for much longer before being stopped by the outfield wall. Accordingly, Comerica was almost four times as likely to see a triple being hit than Yankee Stadium between 2019 and 2021. The aforementioned Fenway Park, by virtue of its outfield walls being closer to home, is more likely to see hits leave the ballpark–about 26% more likely than the average MLB stadium over the past three full seasons, to be exact. Keep in mind that both of these numbers account for the differences in home run hitting ability by team.
However, this relationship starts to break down the further you look. Coors Field in Denver has one of the largest outfield distances in the league, and as you would expect, it sees a disproportionately large number of doubles and triples. Counterintuitively, however, it also sees one of the largest home run totals of any stadium year after year,a phenomenon that has been well documented. The biggest reason for this has nothing to do with the stadium itself, but rather the air inside of it. Sitting at an elevation of about 5200 feet, the air at Coors Field is noticeably thinner than air at sea level, meaning flying baseballs face less drag than they would at lower elevations, allowing them to travel farther. If the outfield walls at Coors were not already so far out, then it is likely the ballpark would see home run totals even higher.
Coors Field alone is a good example of why environmental factors–and not just the shape of the stadium–are worth studying when it comes to how they can affect baseball. Alongside elevation, which determines thickness of the air, there are a couple other factors that have been determined to influence a baseball's movements in flight. Research has shown that higher temperature and higher humidity both lead to baseballs traveling farther as well. To test the extent to which these factors influence offensive outcomes at MLB stadiums, I chose to look at the stadiums' average temperature from April through September (which almost perfectly coincides with the MLB regular season) and the average dew point during that same span (as any meteorologist will tell you, dew point is a much better metric for humidity than relative humidity). To measure offensive outcomes, I decided to account for both home run park factor–how likely any given ballpark is to see a home run hit when accounting for team differences–as well as overall park factor, which takes a more holistic look at offense. Both of these values are the three-year rolling values ending in 2021. Unlike altitude, however, temperature and humidity can be influenced by climate control, meaning only outdoor stadiums can be easily considered.
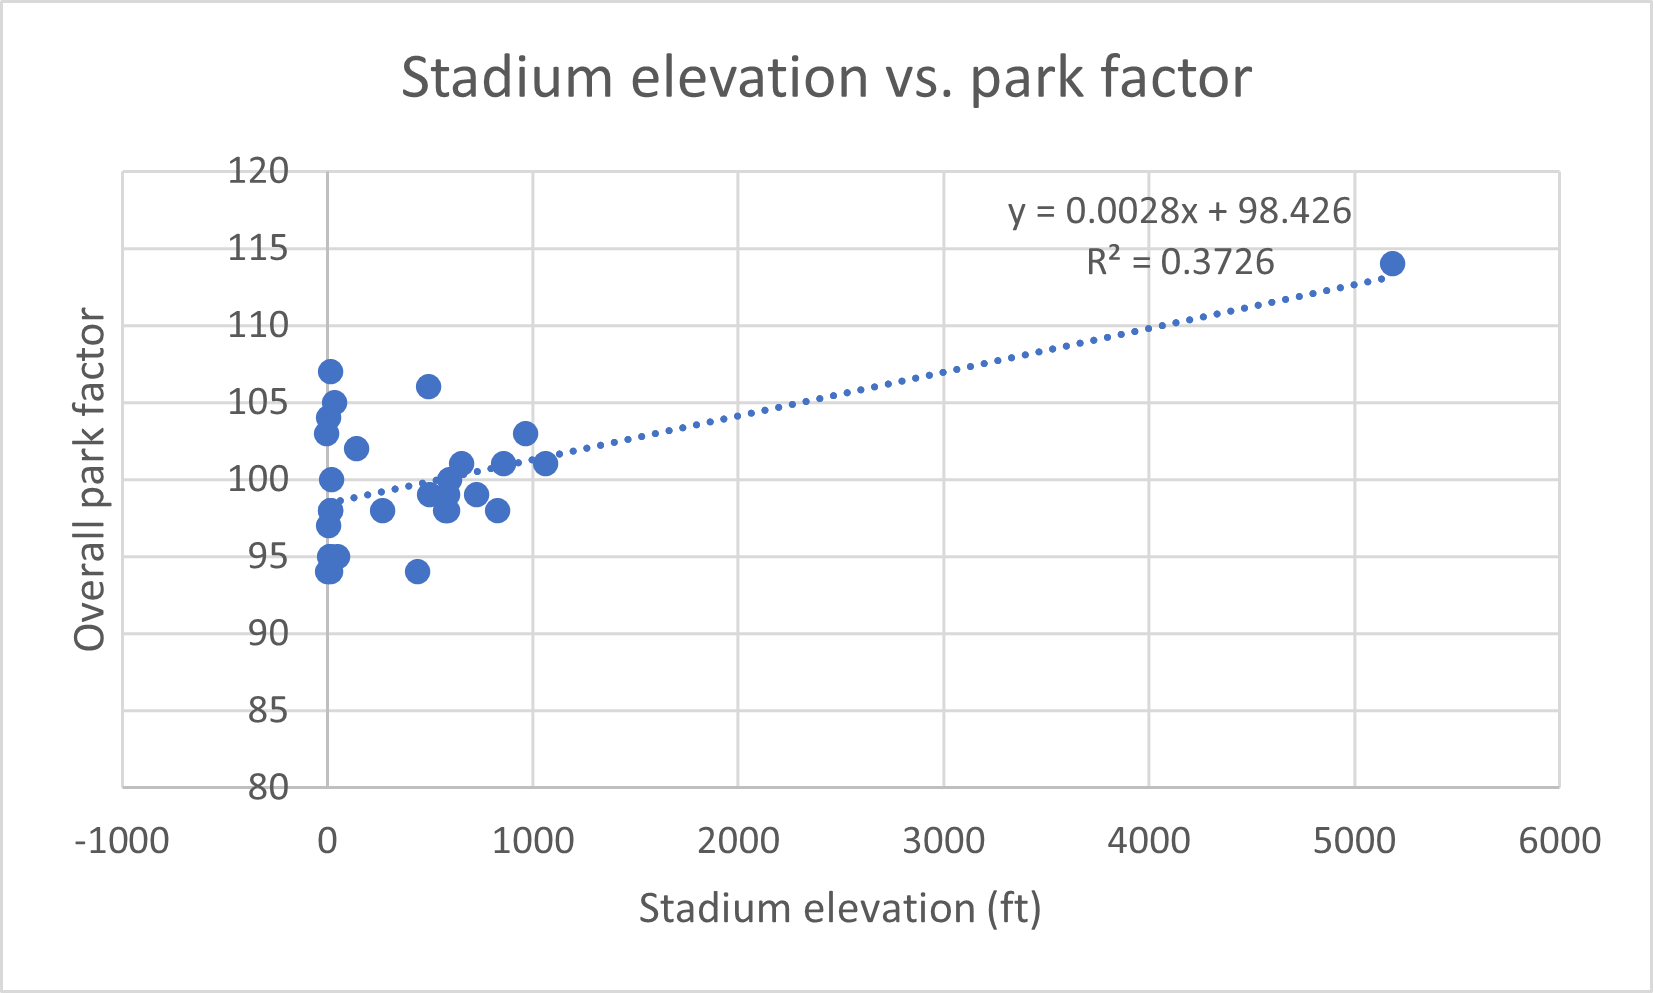
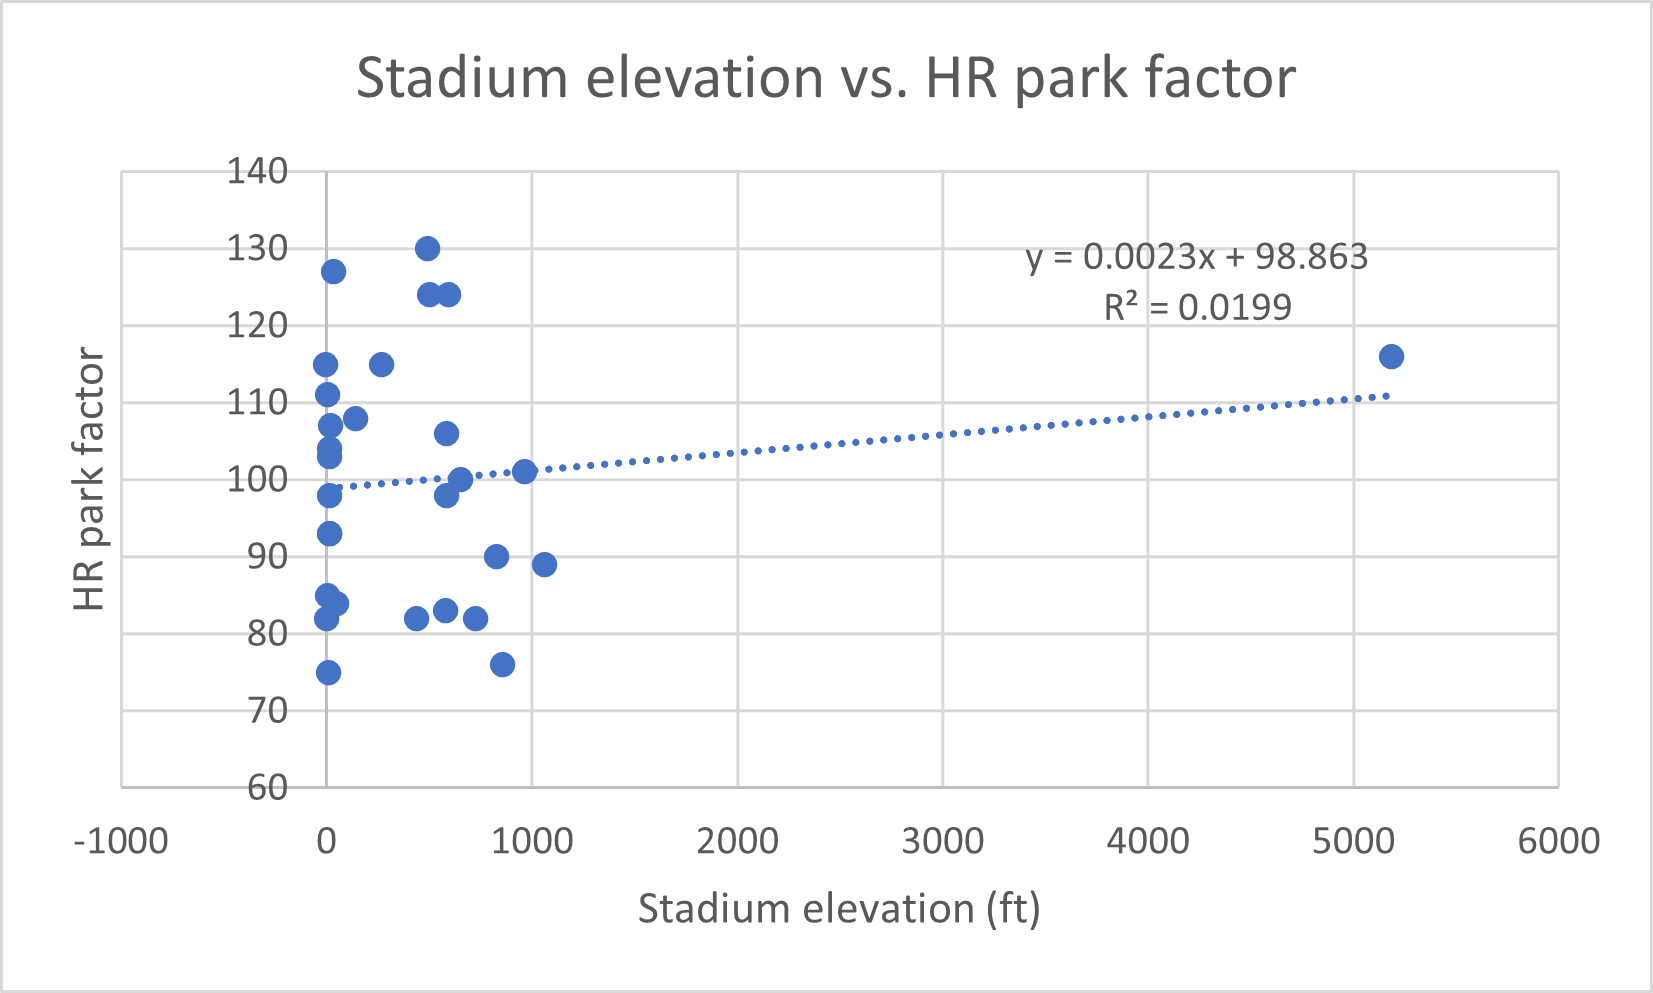
Using simple linear regression, there is technically a positive correlation between stadium elevation and both park factors, but both of these are heavily skewed by a single outlier–you can probably guess which park. (Elevation data from Google Earth, park factor data from Baseball Savant)
To alleviate the problem of the outlier, I decided to look at the log of stadium elevation, which smoothed out the data (Both parks with an elevation of 0 feet or below were treated as having an elevation of 1 foot).
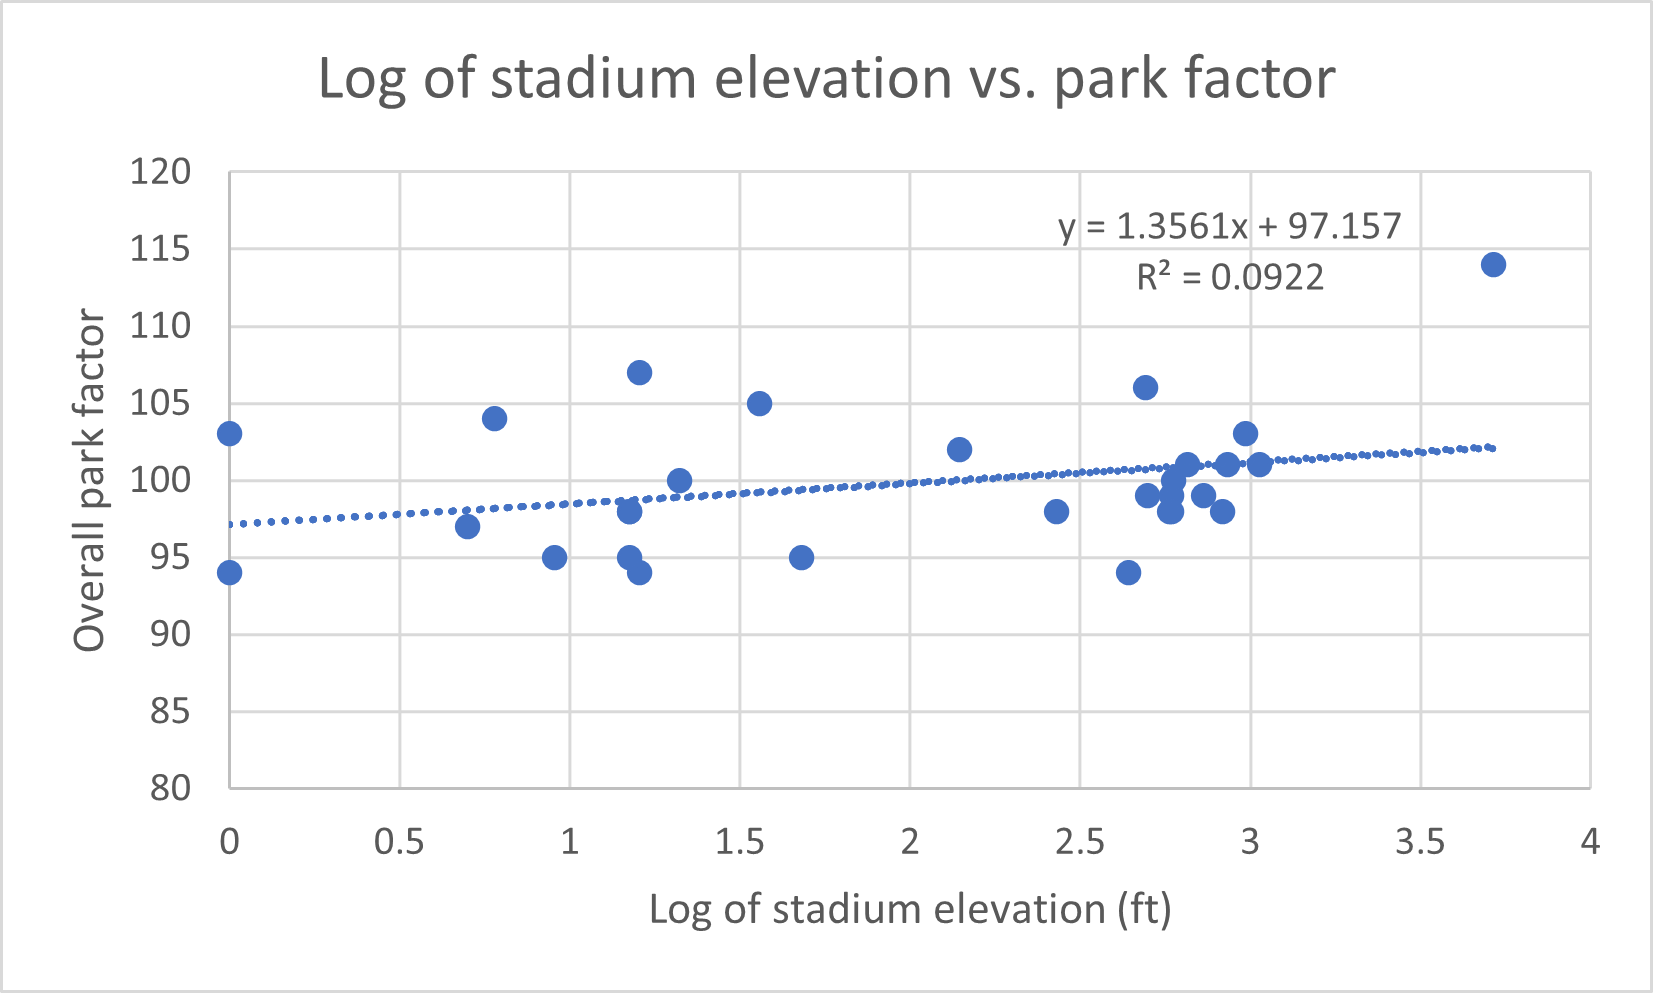
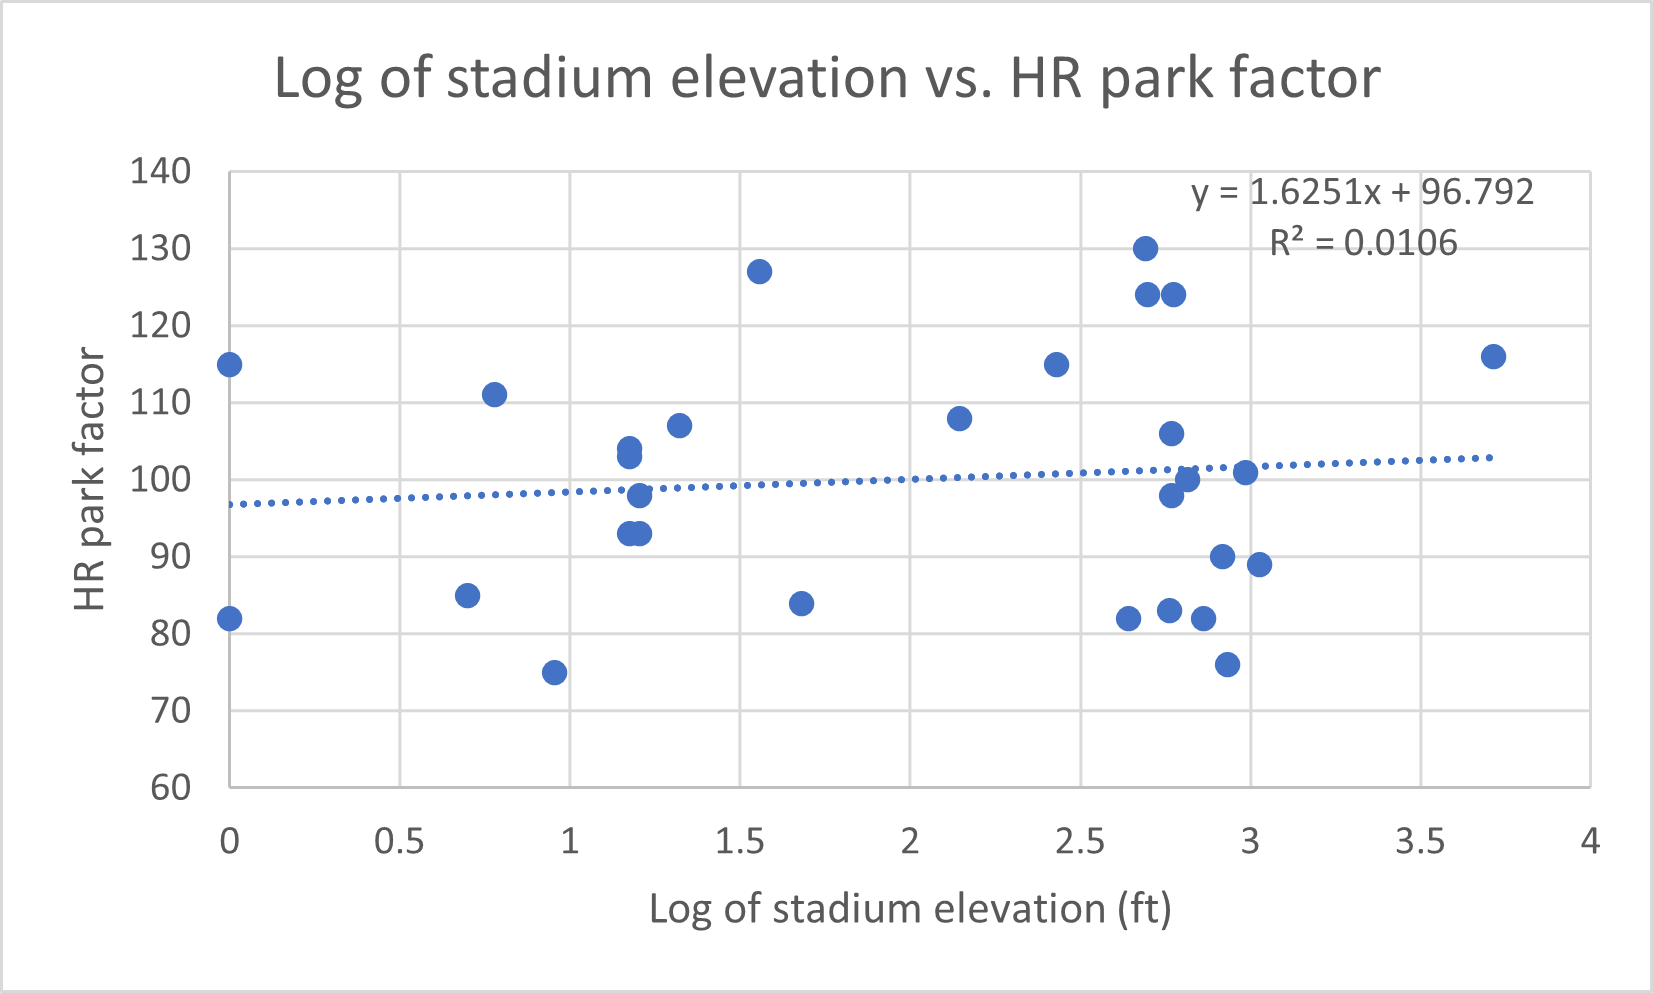
After applying the logarithm, the positive relationship remains, though the low R^2 values imply the correlation is quite weak for both park factors.
With that in mind, I then looked at the relationship between average temperature and both park factors.
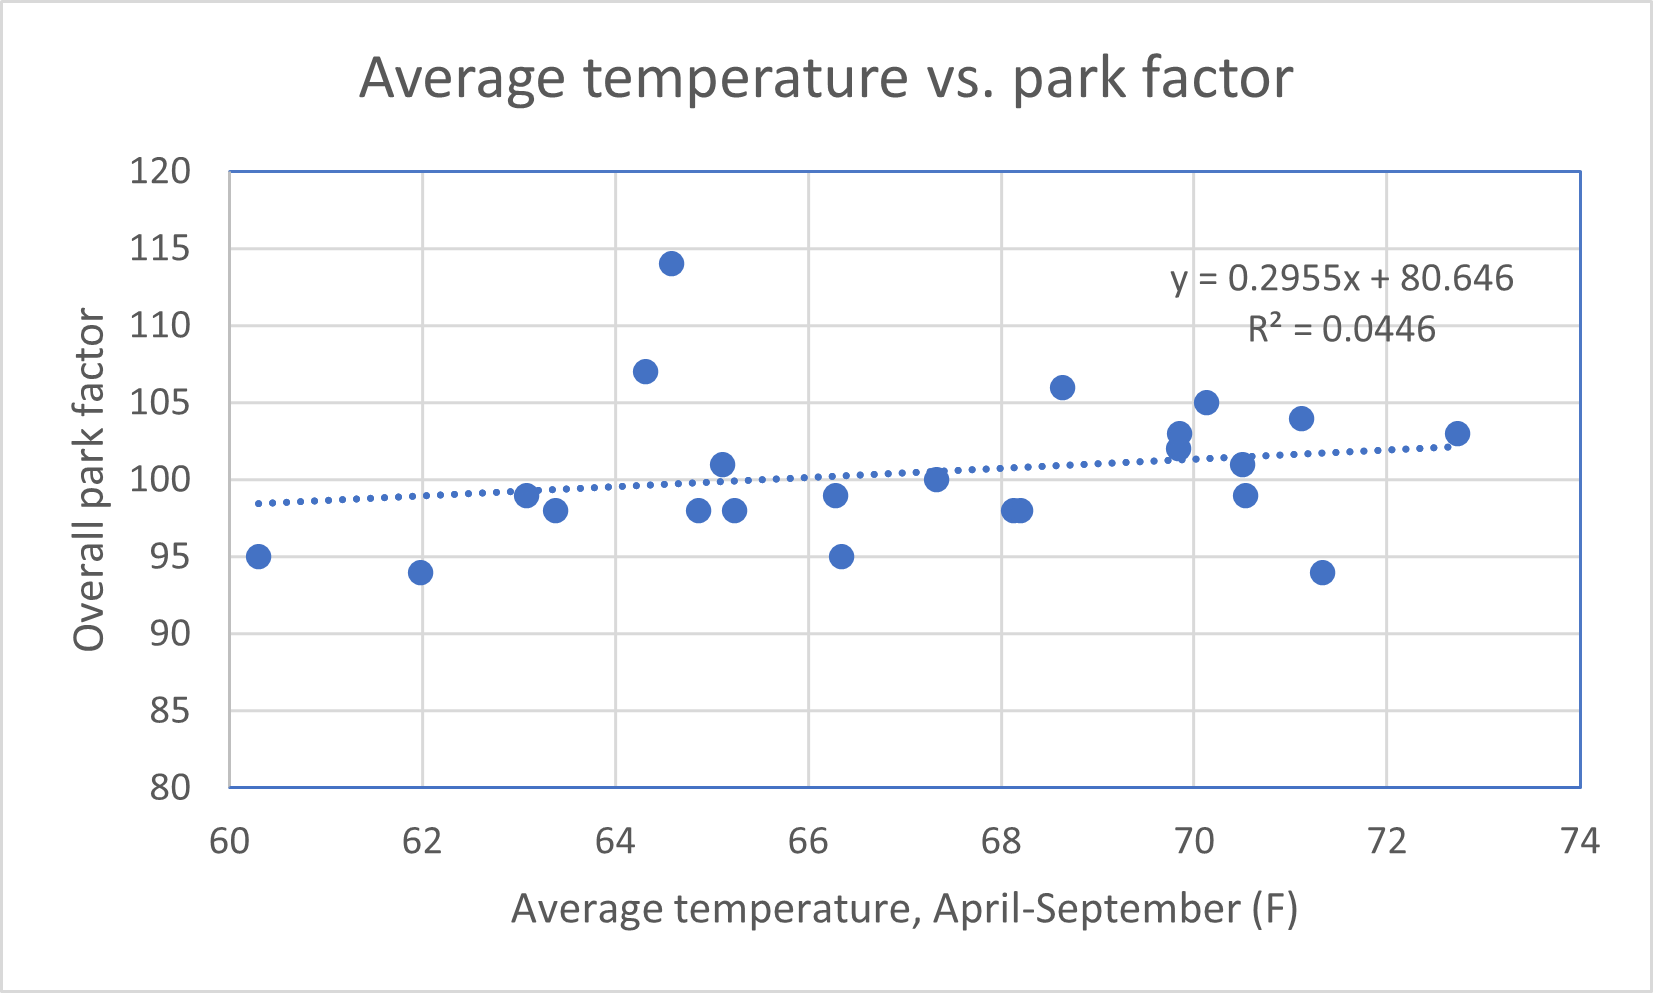
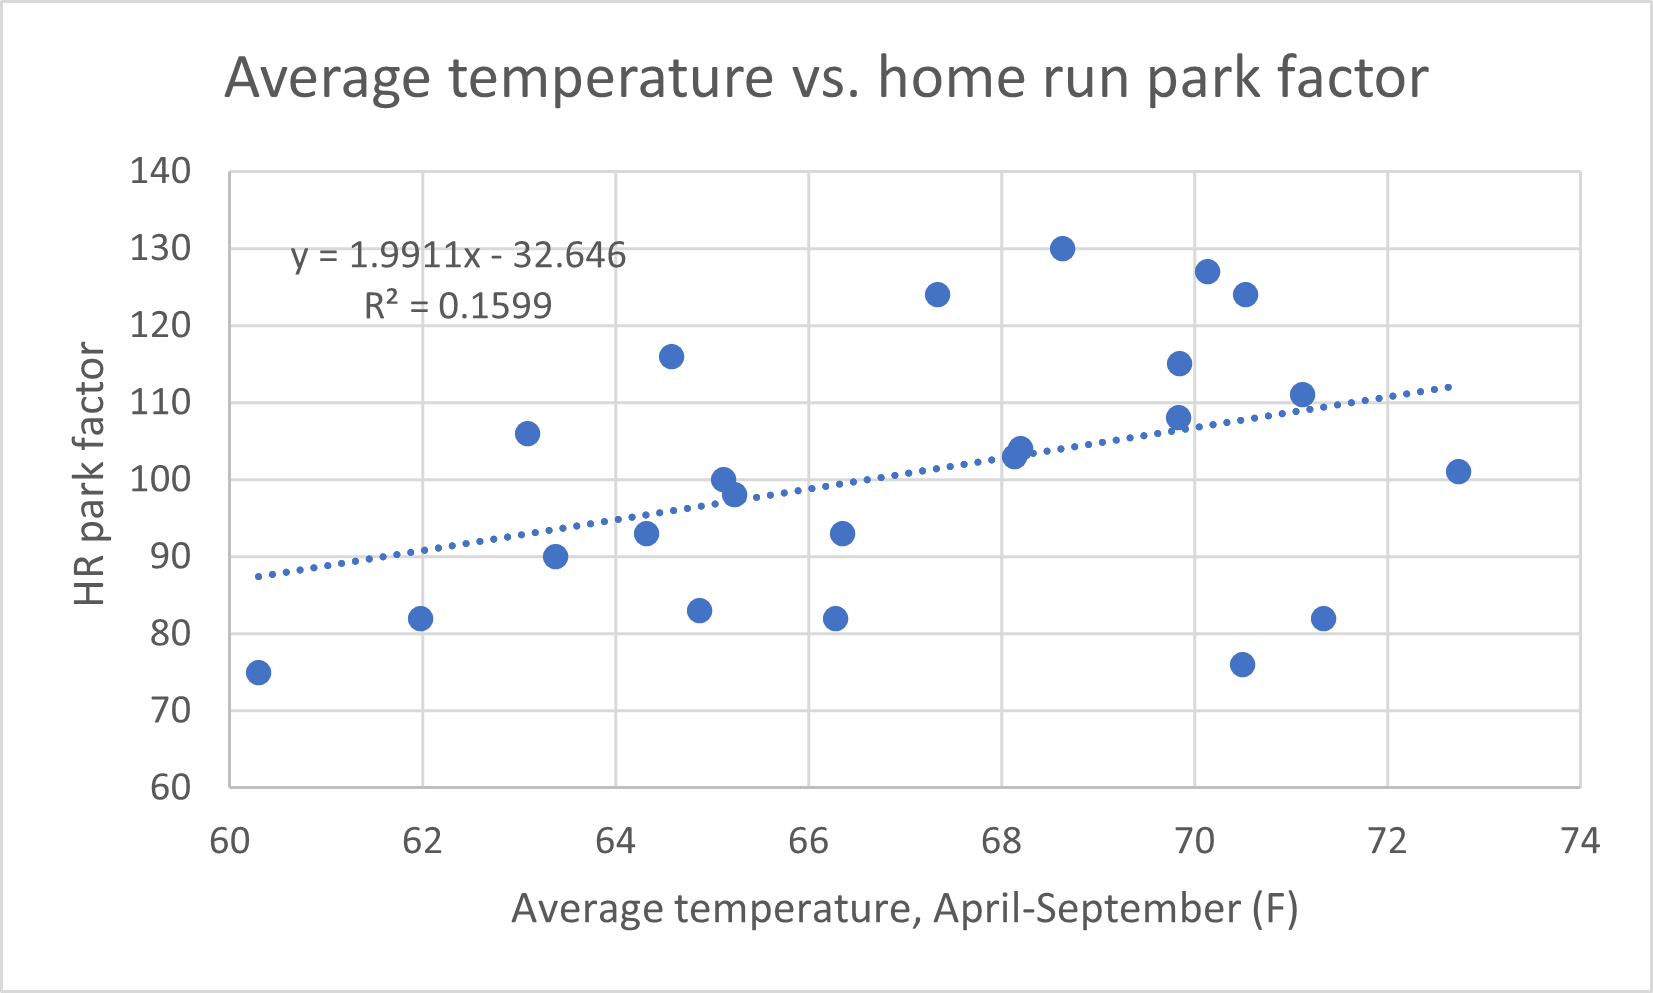
As expected, there was a positive relationship between temperature and the park factors, though again not a particularly strong one. (Temperature data from 1991-2020 climate normals, PRISM Climate Group, Oregon State University)
Interestingly, the p-value for the relationship between temperature and home run park factor was 0.0586, just on the doorstep of statistical significance. However, just by the eye test, neither relationship is strong enough to draw a certain conclusion. On to the effect of dew point.
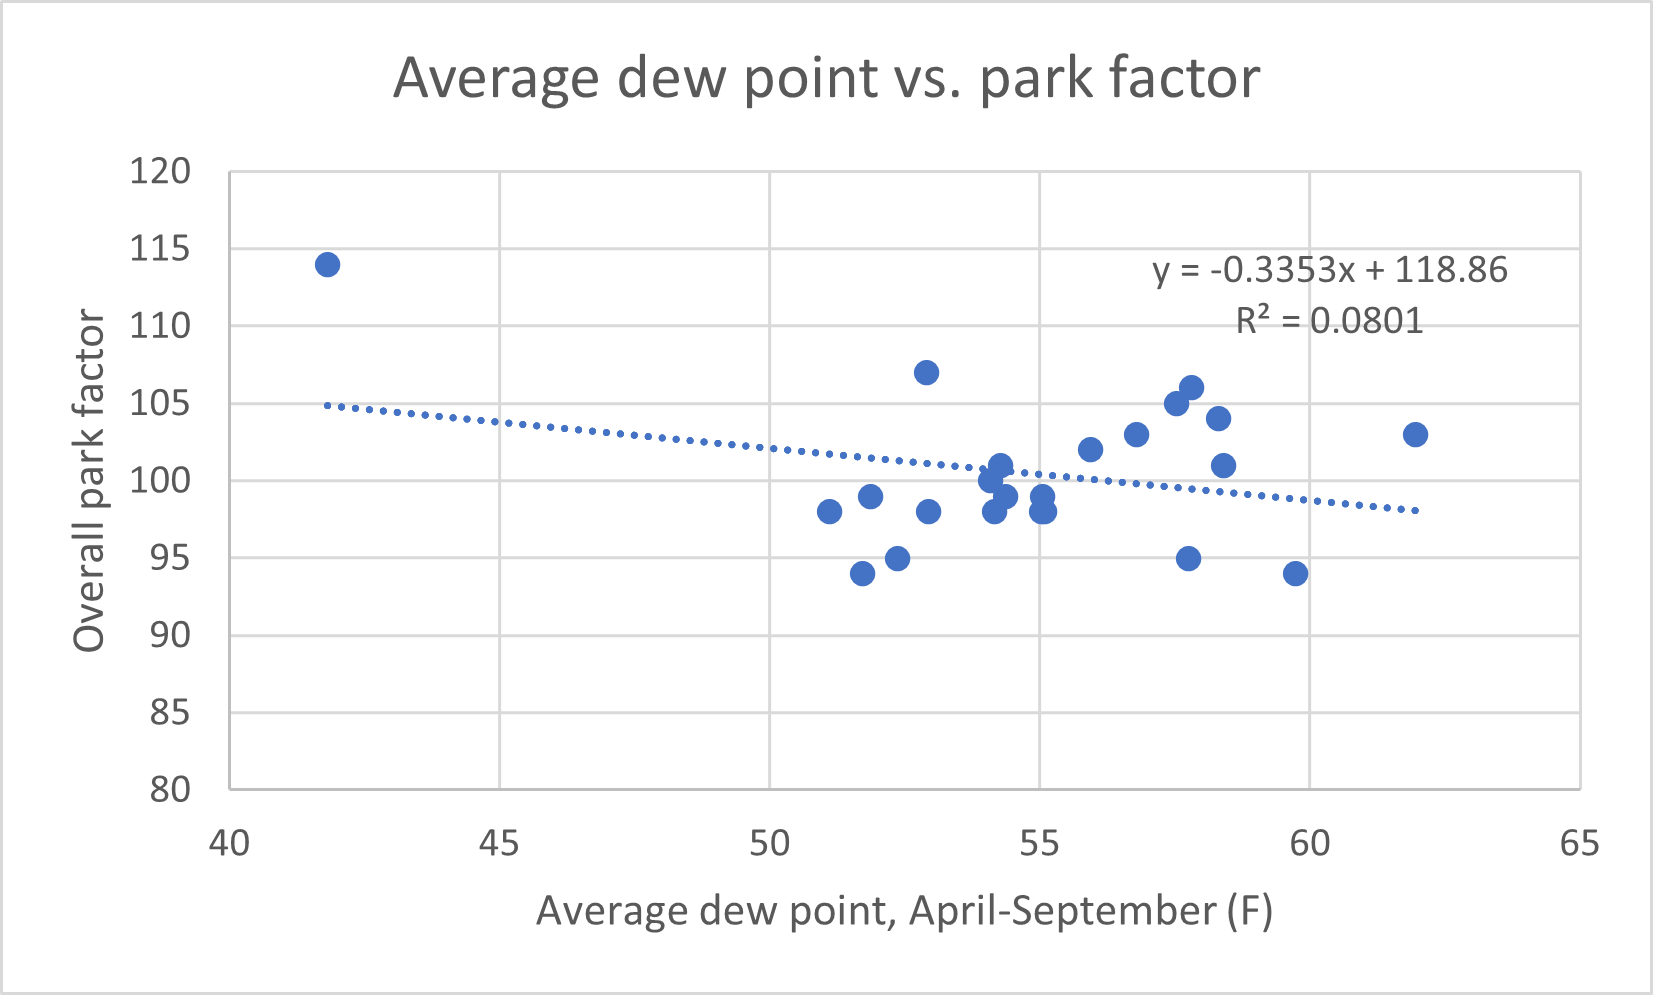
Any guesses as to what that outlier could be? (Dew point data from 1991-2020 climate normals, PRISM Climate Group, Oregon State University)
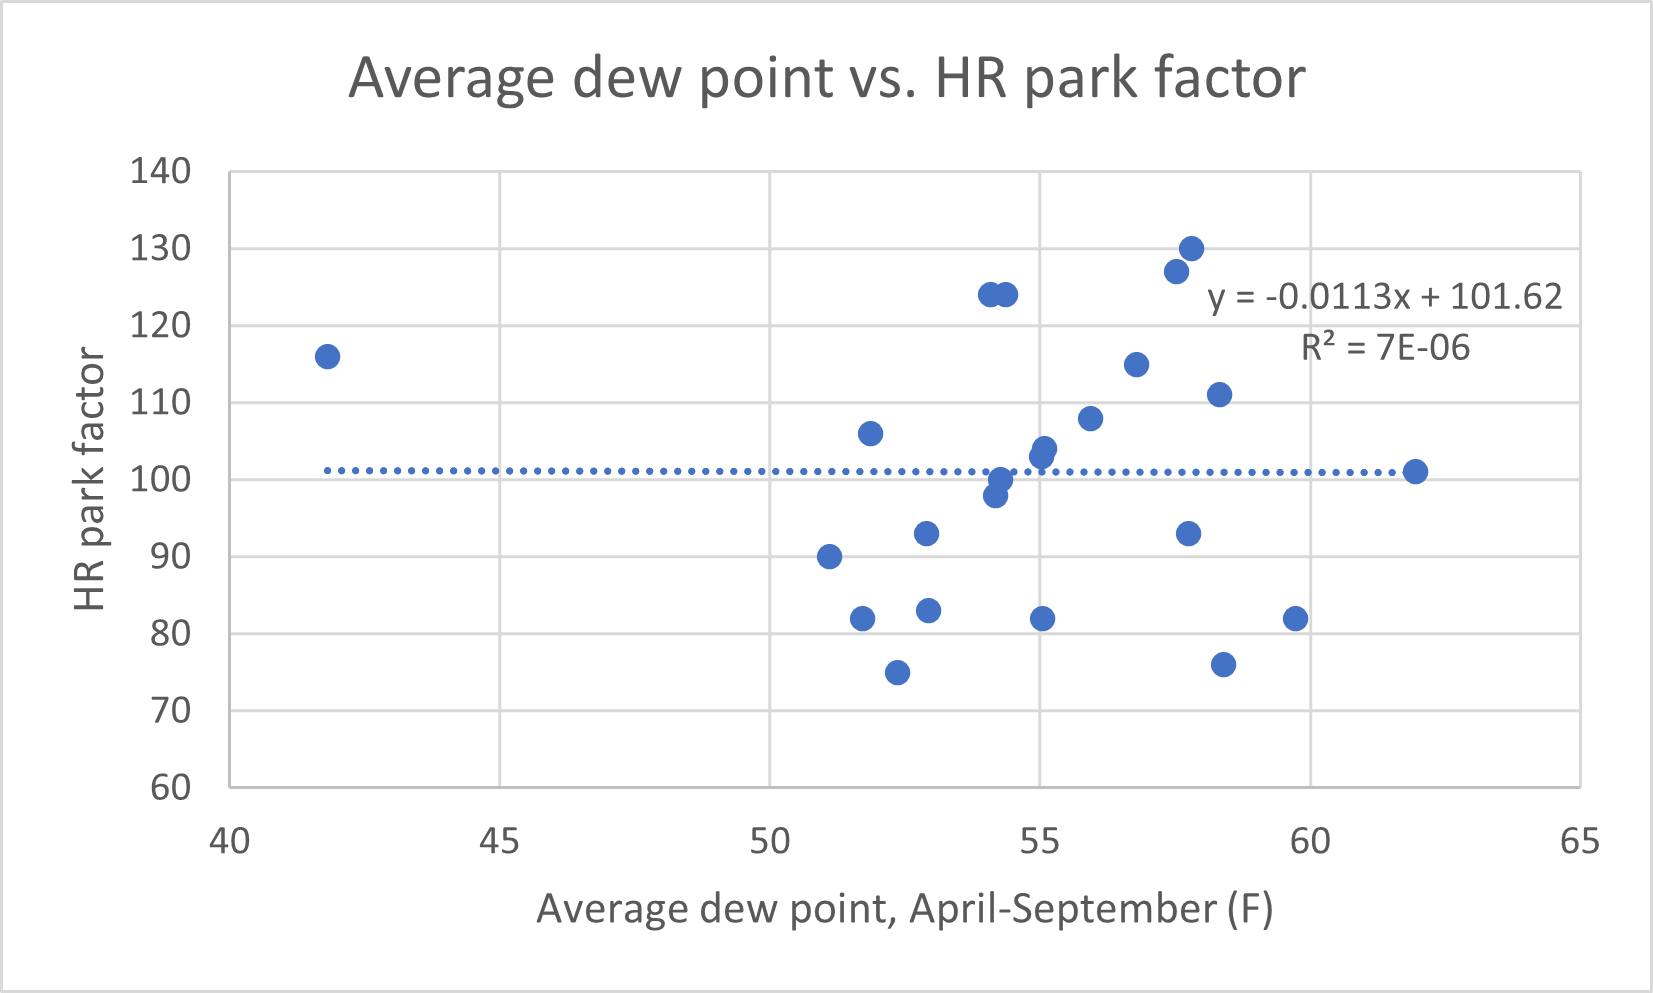
This time, let's remove the outlier completely.
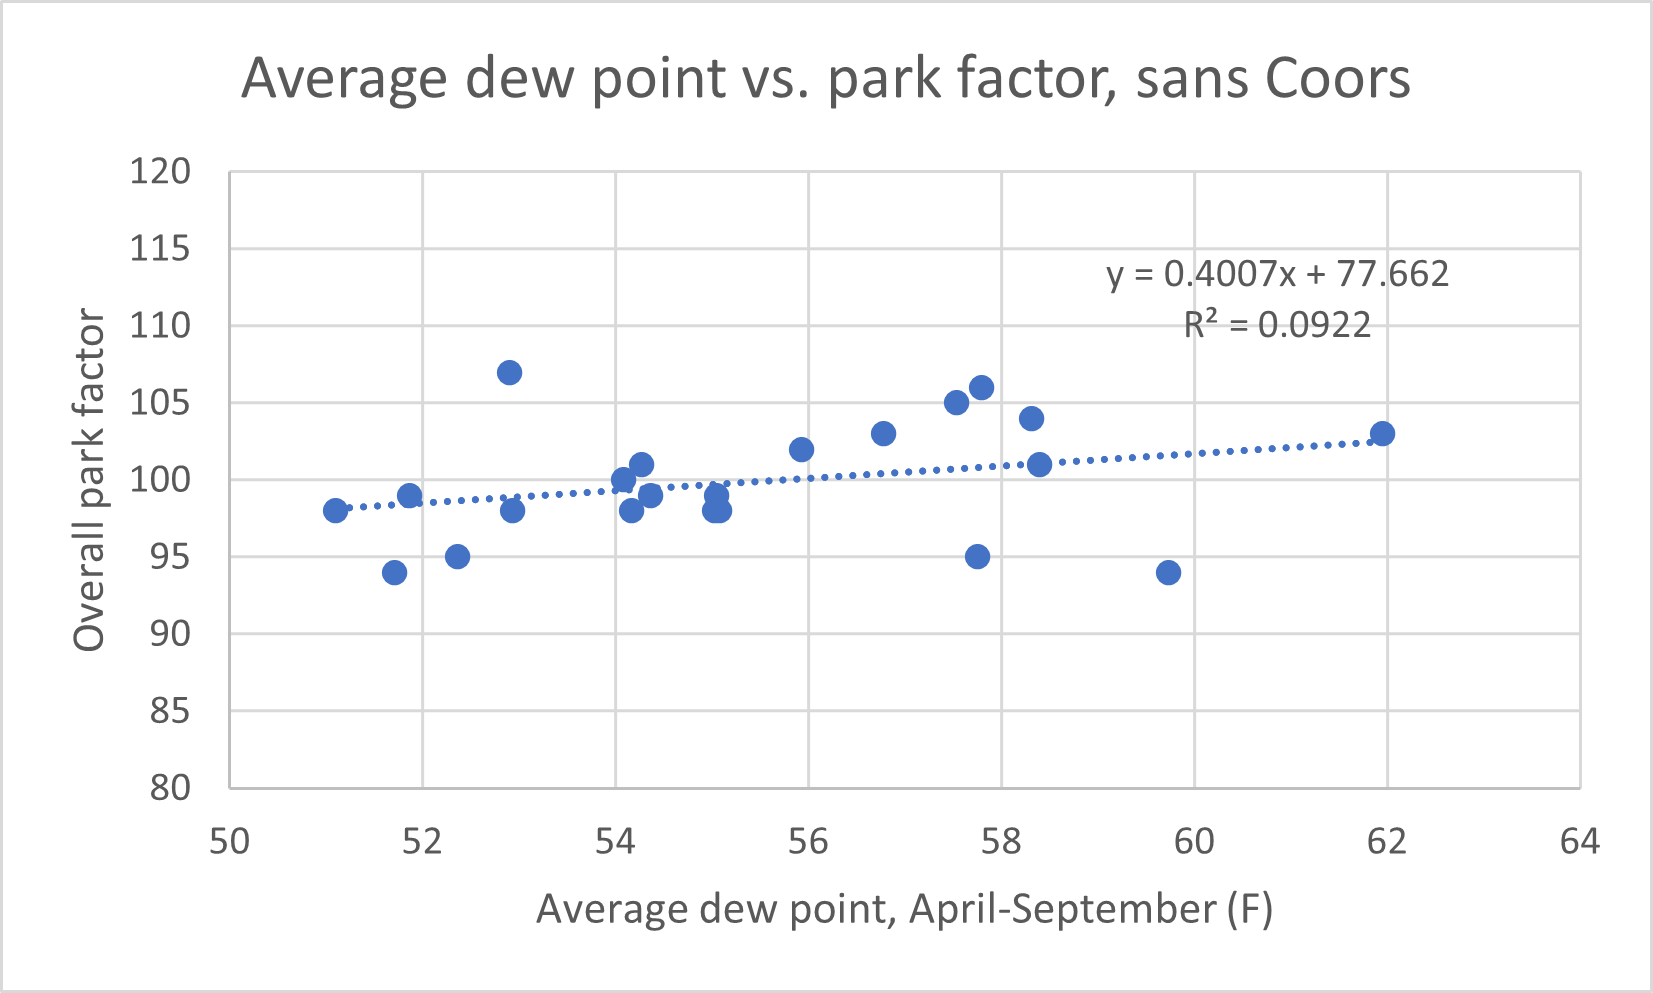
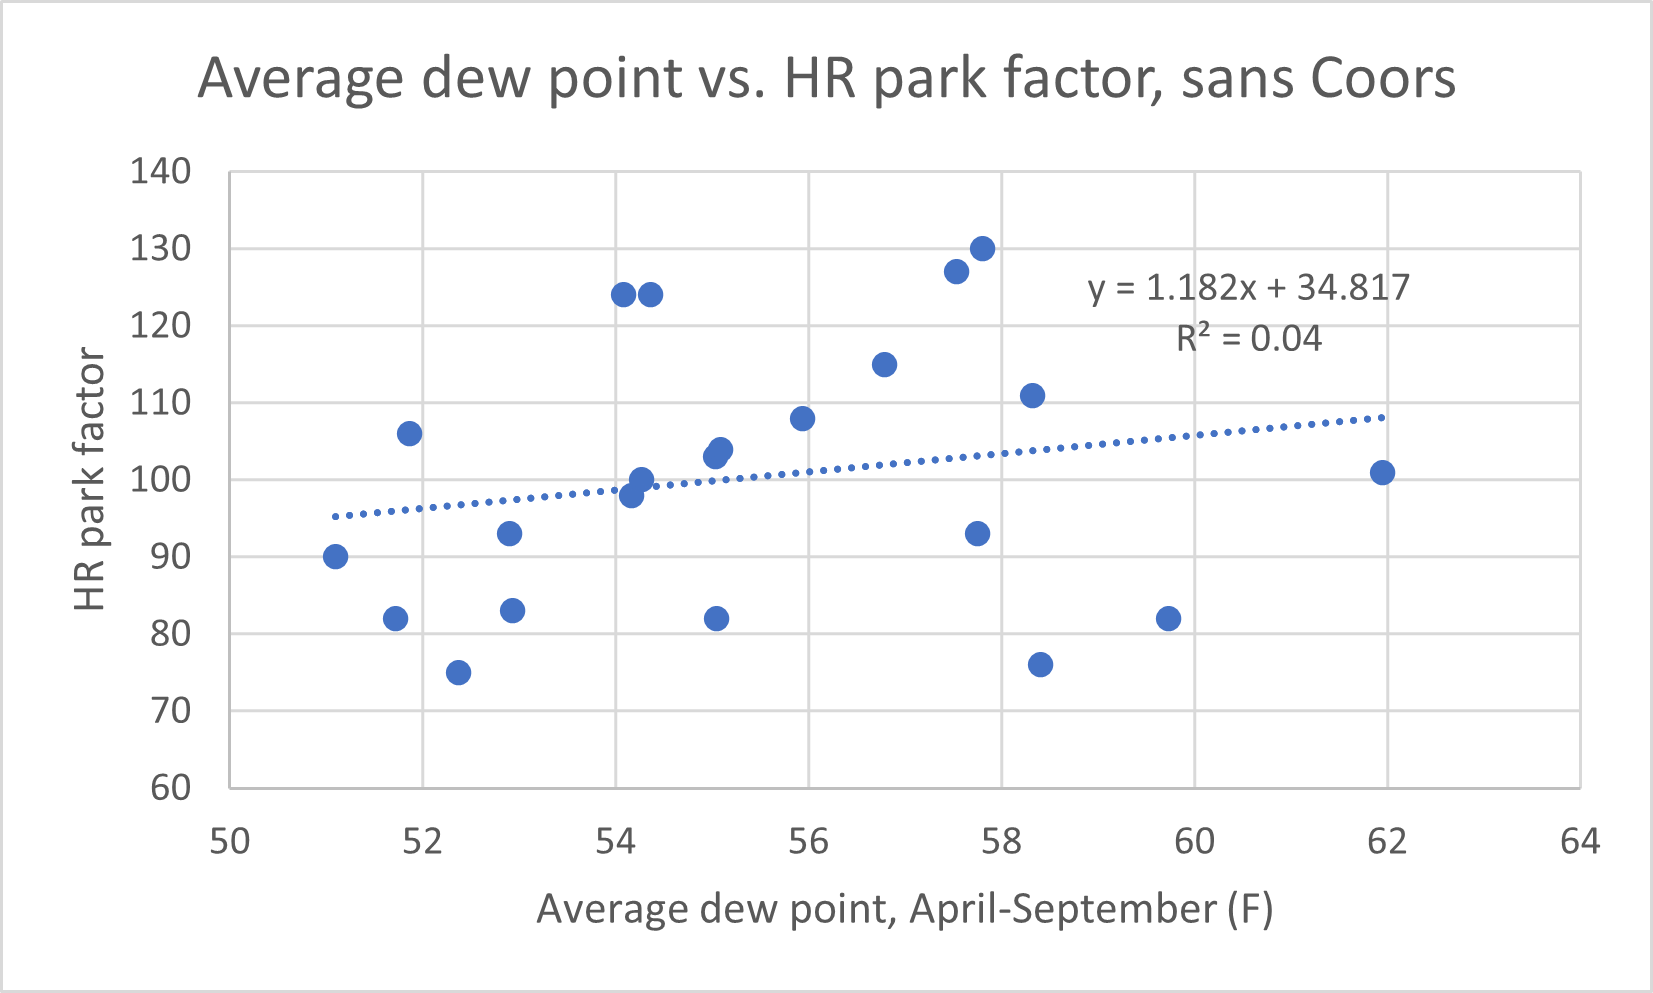
Like with temperature, the relationship between dew point and park factor is positive. Also like dew point, it is not statistically significant (p-values of 0.1695 and 0.3722, respectively).
I should mention that the data above does not account for the varying dimensions of the ballparks involved. Instead, the graphs are only to see if the local climate has an effect on the game being played, and if such effects can be seen throughout the various shapes and sizes of Major League ballparks. In conclusion, no conclusion can be drawn. While the data seems to be pointing towards temperature, altitude, and humidity having some effect on the frequency of certain offensive outcomes, particularly home runs, none of the relationships graphed above are strong enough to confidently conclude anything sweeping. All we can say for certain is that Coors Field's high elevation (which makes home run totals go up) greatly outweighs its very low humidity (which makes home run totals go down), as home runs are very common there. Is that indicative of a lead-wide trend? I'm not sure, but further investigation is warranted.